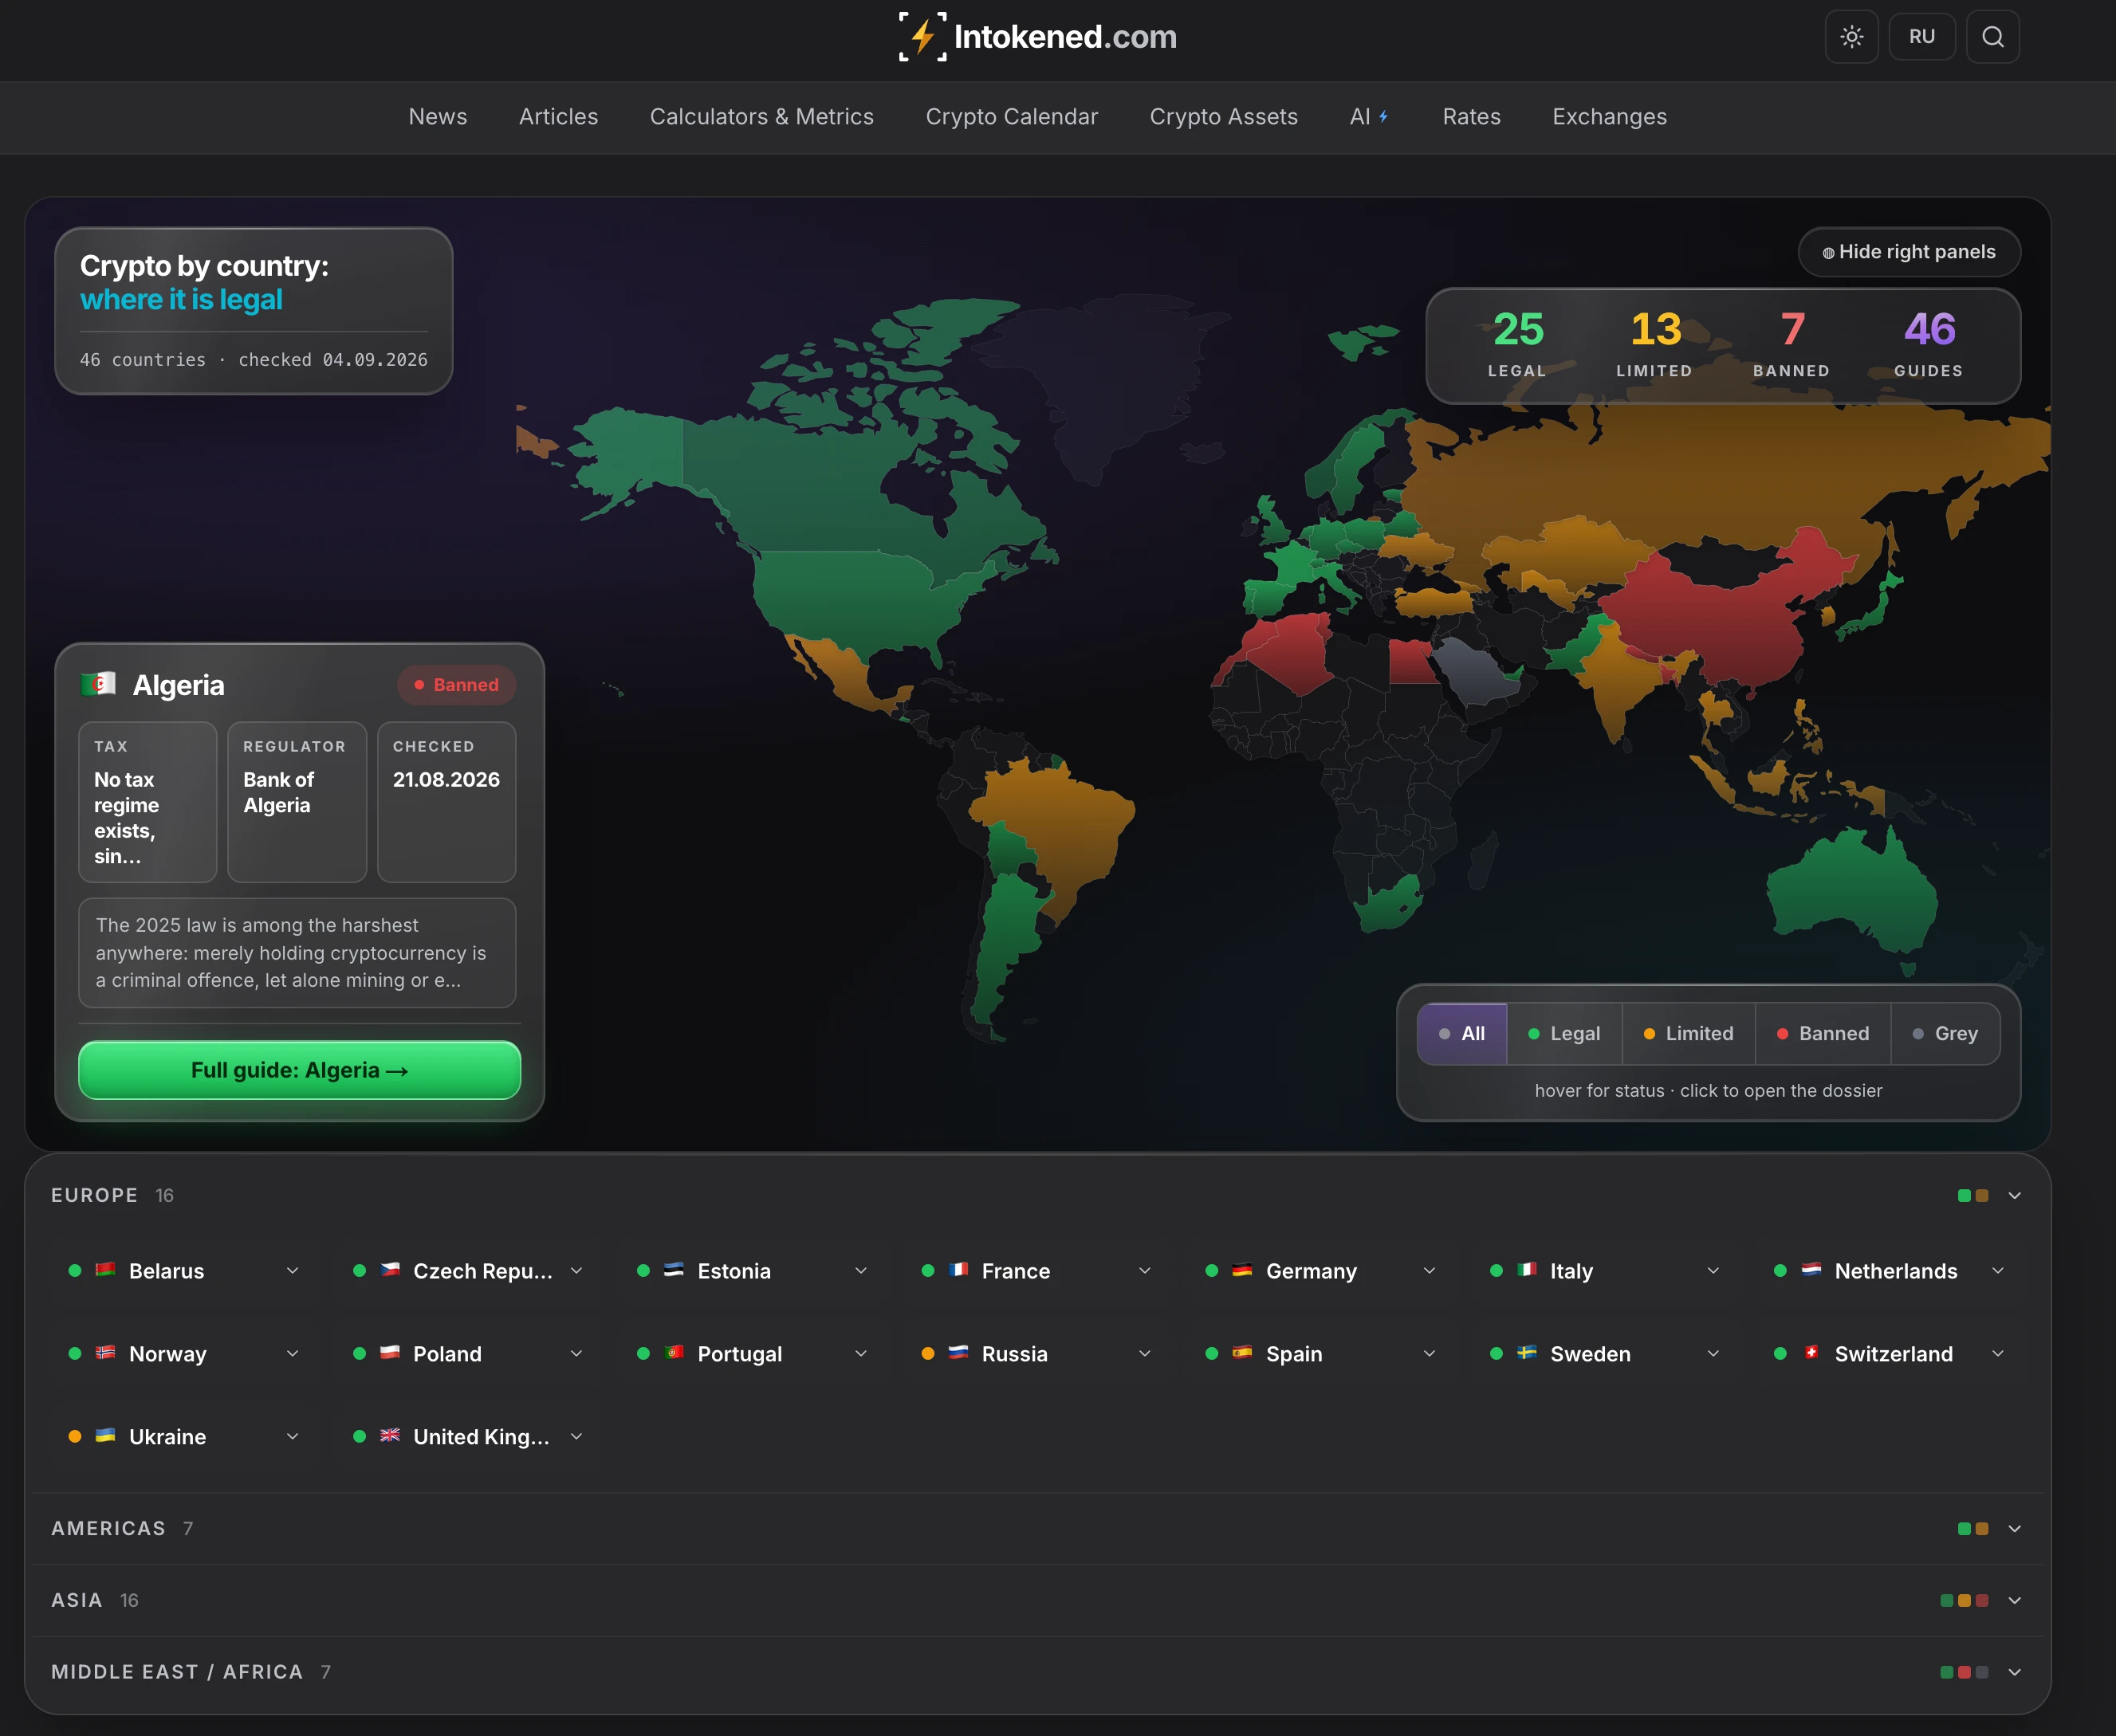
Most crypto regulation maps colour a country green and leave you there. Ours names the regulator, lists what you may legally do, and prints the date a person last read the rules.
The regulation map covers 46 countries, and each one opens into a full page rather than a tooltip. Twenty-five run legal regimes, thirteen run restricted ones, seven ban crypto outright, and one stays unclear. That last country is Saudi Arabia, and we left it in its own category instead of rounding it into a friendlier one.
Open the United Arab Emirates and you get the structure that actually governs the country. Federal oversight passed to the new Capital Market Authority on 1 January 2026. Dubai’s VARA runs its own rulebook alongside it, and the Abu Dhabi Global Market runs English common law through the FSRA. The country runs three regimes side by side, and that is the design rather than an accident of drafting. Singapore names MAS. Germany names BaFin. The United States names the SEC and the CFTC. China is one of the seven bans, and the page says what the ban reaches and what it leaves alone.
Every country page carries a check date. Ours read 18 to 21 August and 4 September 2026. We put the date on the page instead of a year in the headline, because a headline that says 2026 ages badly by March and tells you nothing about when anyone last looked.
What sits around the map
We publish in English and Russian, and neither language gets a machine translation of the other. Both versions come out of the same research, written separately. Since 24 June 2026 that has produced 1,019 news stories and 79 longer articles, which is 2,196 pages across the two languages.
The tools are our own arithmetic rather than embedded widgets. Market Pulse compresses turnover, price, volatility, sentiment and altcoin behaviour into one number from 0 to 100, where 50 means an ordinary market and not a bullish one. The Altcoin Season Index counts how many of the top 100 coins beat bitcoin over 30 days, recalculated live, with the leaders and the laggards listed underneath. The Fear and Greed Index page explains the inputs rather than only printing the score.
For the practical side there is a converter on live rates, a USDT and USDC to euro page that compares P2P against exchange pricing, a crypto calendar of 40 dated market events, 16 exchanges ranked by volume, guides to 24 major assets, and a glossary of 87 terms, which our articles link into as they go. Our AI section holds 213 stories on where machine learning touches this market, which is roughly a fifth of everything we have written.
How we check
We measure the claim before we repeat it, and the measurement often kills the story we were sent.
A headline told us Morgan Stanley had bought $609 million of bitcoin. The bank had not bought any: the figure was the size of a fund wrapper it charges 0.14% a year to run. Another told us Cardano faced a 1,085% liquidation spike. The underlying number was a ratio of 10.86 to one between short and long liquidations, which is a different sentence. A third reported growth in Tron’s stablecoin float on a week when it fell half a percent. India’s $627 billion tokenisation plan was $561 billion once you used the rupee rate on the day instead of an older one.
None of that requires access. It requires pulling the source data and doing the division, which takes minutes and few outlets bother with.
The same habit runs through the market work. When we ask whether tomorrow’s Fed decision will hit crypto harder than last year’s did, we go and measure both. Bitcoin’s thirty day volatility runs 1.56 times what it ran a year ago, while its average move on a Fed decision day has fallen from 1.44% to 1.26%. The market got wider and the Fed days got quieter, which is the opposite of what the framing led us to expect, and it is the reason the piece was worth writing.
Start with the map. If your country is on it, you will know in thirty seconds what you may legally do and when somebody last checked.
